Even if you’ve never heard of graphic organizers, chances are good you’ve been using them in one form or another all your life. That pros and cons list you made before making a big purchase? The family tree you’re working on? Your school’s org chart? They’re all graphic organizers. Here’s what you need to know about using this powerful tool with students of all ages.
What are graphic organizers?
Source: @thecomfortableclassroom
Put simply, graphic organizers are a way of organizing information visually to help students understand and remember it. They’re tools that let kids make connections, create a plan, and communicate effectively. A good organizer simplifies complex information and lays it out in a way that makes it easier for a learner to digest. Graphic organizers may include text and images, depending on the purpose and student’s learning style.
[contextly_auto_sidebar]
How do I use them?
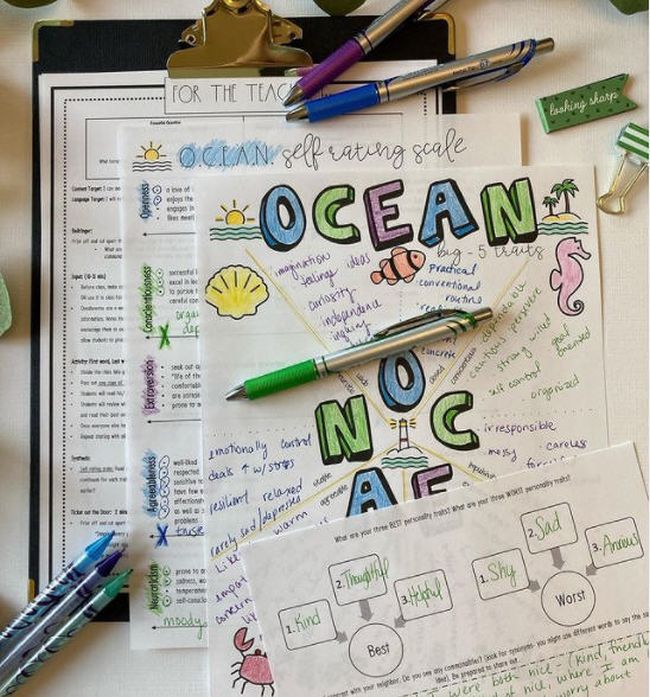
Source: @yourteacherbestie
You can provide students with pre-printed organizers or encourage them to draw their own. Either way, teach students how to use them by modeling the behavior first. Consider making anchor charts for commonly used types so students can refer back to them as they work.
With younger students, work to help them understand how to choose certain types of organizers depending on their goals. For instance, students taking notes while they study may find a concept map most helpful. When comparing two topics, a Venn diagram or T chart is probably the best choice. Here are some ways to use graphic organizers in various subjects (and explanations of them below).
Language Arts
- Use a story map or story mountain to diagram the characters, setting, and key plot points.
- Try a web organizer to keep track of character relations and connections.
- Learn vocabulary words with a Frayer model that lays out meaning, synonyms, examples, and illustrations.
- Map out the topic, main ideas, and supporting facts of an essay before you start writing.
- Use a story map or mountain to plan creative writing.
Math and Science
- Use a Frayer model to define and understand terms and formulas.
- Compare two or more concepts with a Venn diagram (like area and perimeter).
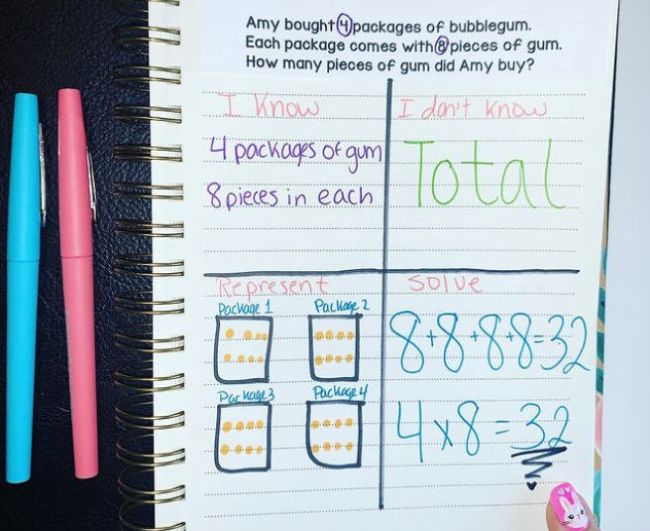
- Create a visual representation to solve a story problem.
- Plan an experiment with a sequence organizer.
- Start the exploration of a new topic with a KWL organizer to understand what students already know, what they want to learn, and what they do learn.
General
- Draw a timeline to understand the order of events in history.
- Use idea webs or concept maps to keep track of information as you read and help you study.
- Dig deeper into a topic with a cause and effect organizer.
What types of graphic organizers should I use in my classroom?
Graphic organizers come in a wide array of styles. Here are some of the most common types to try with your students.
Story Map
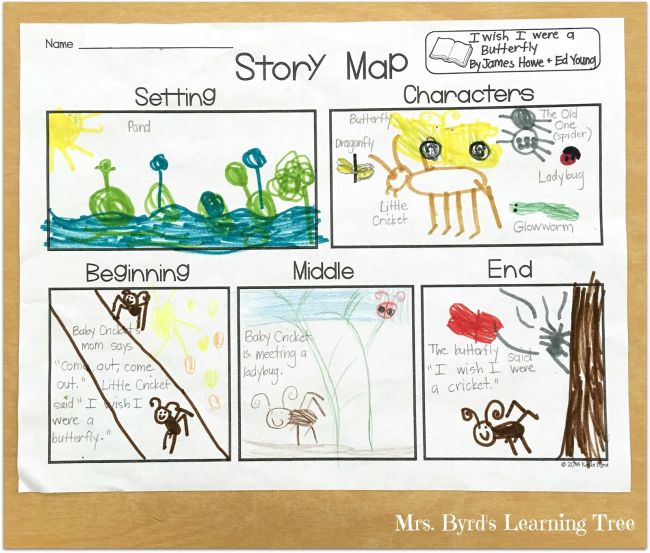
Source: Mrs. Byrd’s Learning Tree
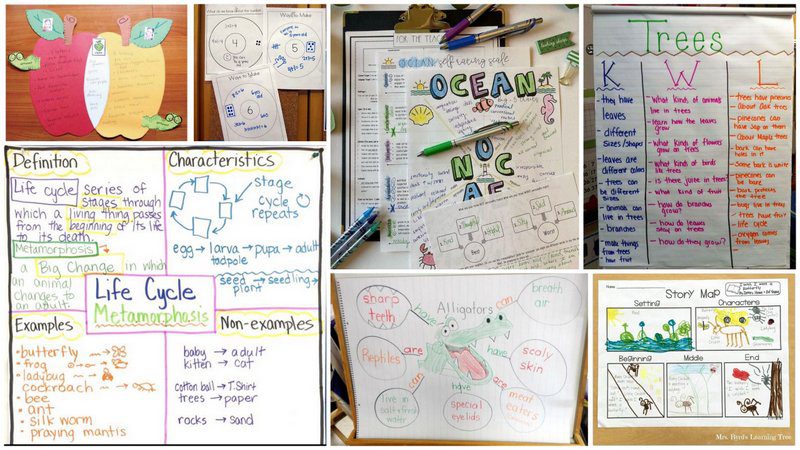
This is one of the first organizers many kids learn to use. For little ones, story maps are simple, laying out the setting, characters, and beginning, middle, and end. Older students can expand the map to take in more details.
Timeline and Sequence of Events
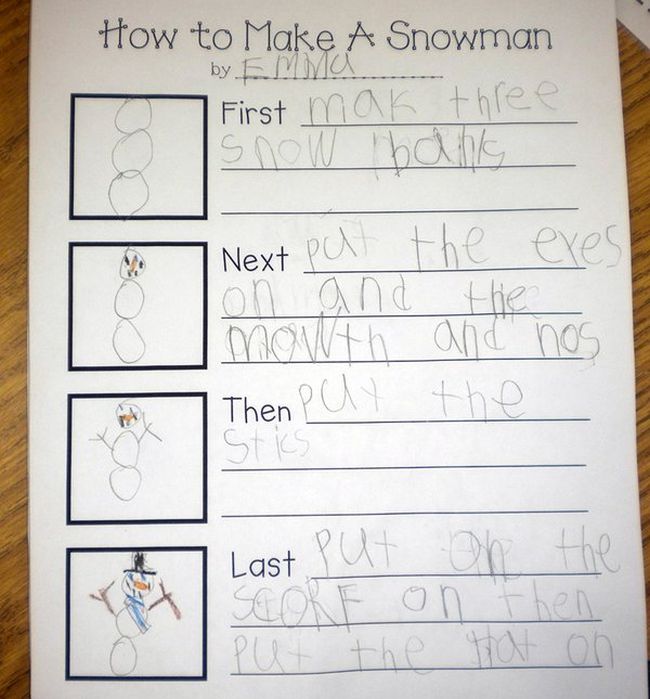
Source: Growing Kinders
Here are two more common organizers kids will recognize. Timelines are generally used in history and social studies classes, though they can be helpful when reading books too. Use sequencing organizers to lay out the steps of a procedure or science experiment.
Story Mountain
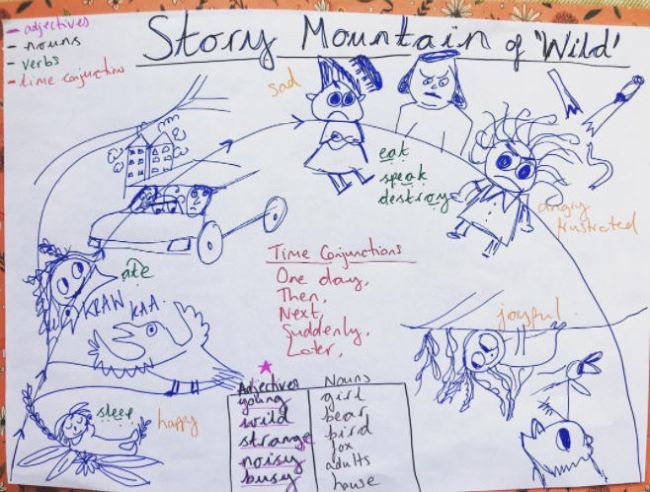
Source: @goodmorningmissbagge
A story mountain is helpful both when reading and preparing to write. Students map out a story from start to finish, building up to a climax and back down to the conclusion.
KWL Chart
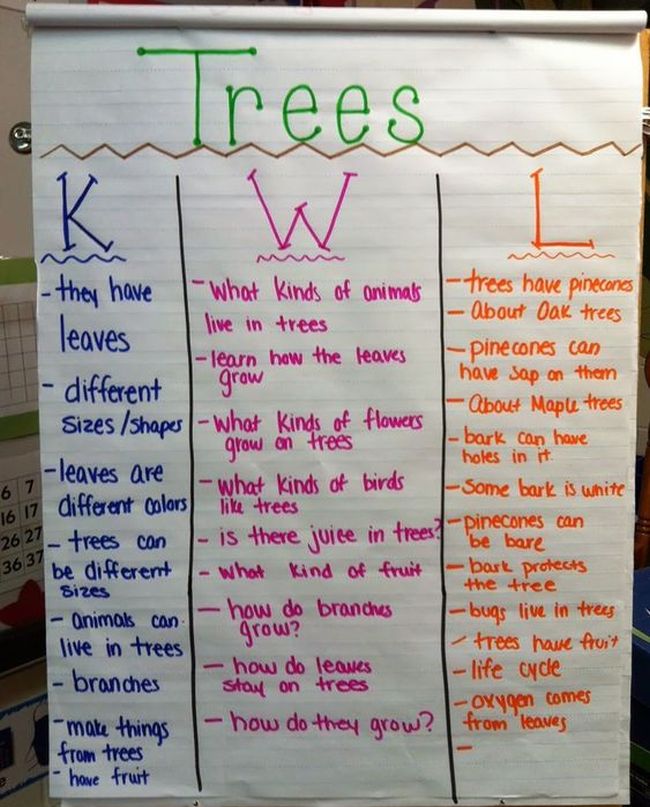
Source: Mrs. Kurt’s All Star Kindergarten Blog
KWL (What I Know, What I Wonder, What I Learned) charts are a terrific way to help kids think about what they want to learn about a topic and hold them responsible for actually finding out that information. The first column is a list of everything they already know. The second column lists what they’d like to learn, and the third one provides new information acquired along the way.
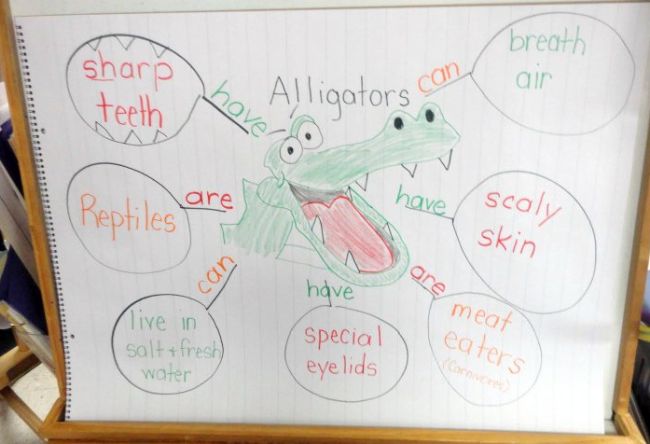
Idea Web
Source: Krazy for Kindergarten Goes to Third Grade
When there’s a lot of information to remember about a subject, idea webs are a terrific way to organize it all. It’s a more interesting way to explore a subject than just making a list or taking notes and one that’s more likely to help kids actually remember the information.
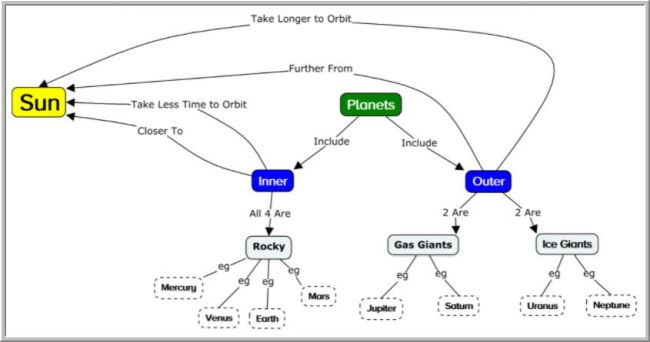
Concept Map
Source: Evidence-Based Teaching
A concept map takes an idea web to the next level. It’s really a series of idea webs, with connections drawn between. These can get very large, so encourage older students to explore online programs that can help them create useful diagrams.
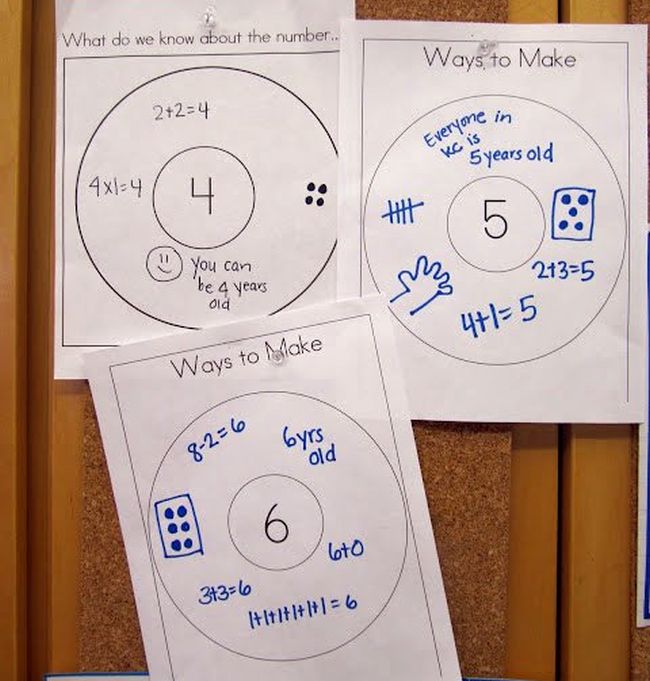
Circle Map
Source: Joyful Learning in KC
Circle maps are terrific for brainstorming or thoroughly understanding a specific concept. In some cases, circles can continue to expand outward. For instance, a circle map could begin with your hometown in the middle, with a larger circle for your state, another for your country, then your continent, and so on. Inside each circle, students write info relevant to that subject.
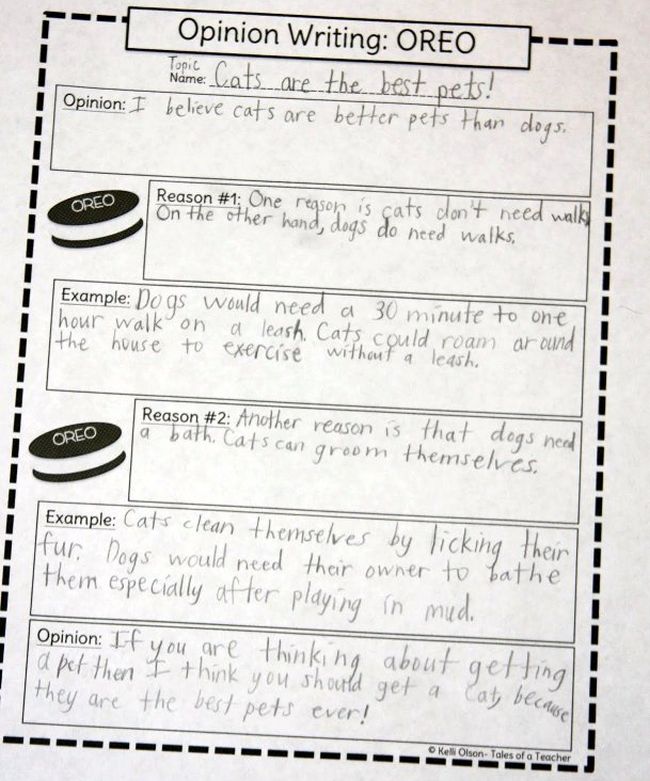
Essay Map
Source: A Learning Journey
Graphic organizers are especially useful when planning any kind of writing. OREO and Hamburger models are common, but you’ll find a lot of other options out there too. The key is to make sure the organizer helps students define their main idea, gather supporting evidence, and draw a conclusion supported by the facts.
Frayer Model (Vocabulary)

Source: What I Have Learned
The Frayer model has a lot of uses but is most often applied to vocabulary. The term goes in the middle, with four sections surrounding it for definition, characteristics, examples, and non-examples. Another version has sections for definition, synonym, an illustration, and using the term in a sentence.
Cause and Effect Graphic Organizer
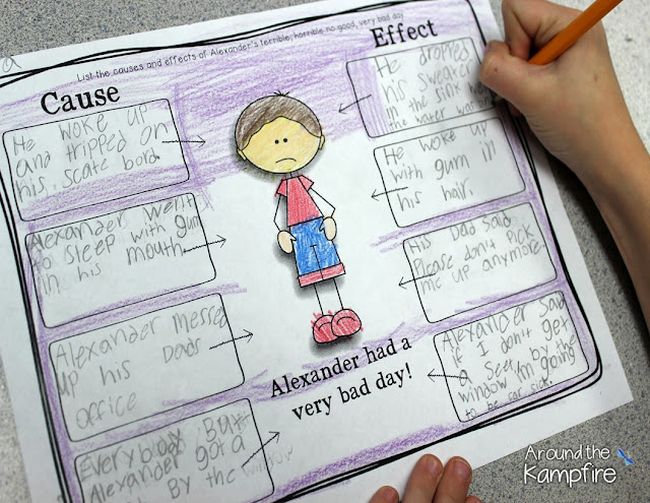
Source: Around the Kampfire
When you want students to dig deeper into the material, try a cause and effect organizer. You can use it in pretty much any subject to make connections between actions and results.
T Chart
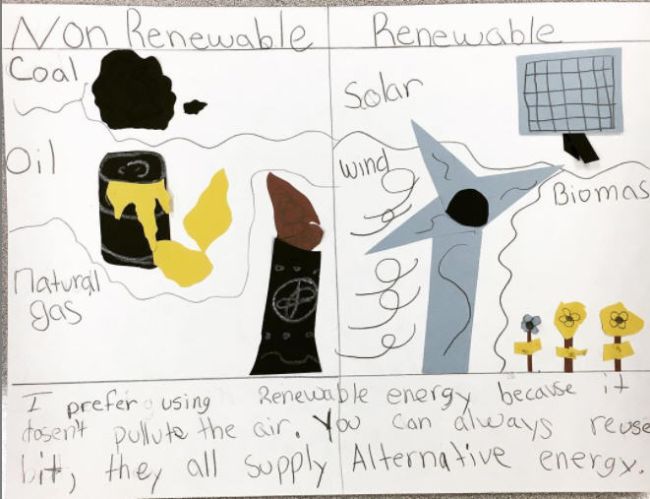
Source: @ducksntigers13
A T chart is a very simple way to compare two related subjects. Many people use these all the time, especially when writing pros and cons lists.
Venn Diagram
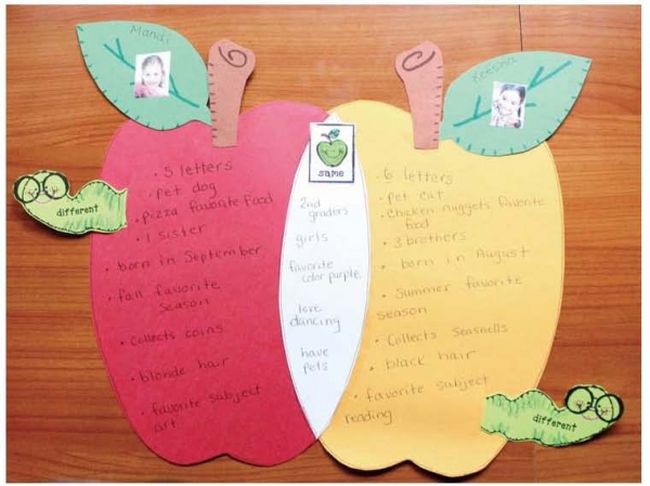
Source: Teach With Me
A Venn diagram is another way to compare and contrast material, looking for similarities and differences. The simplest version has two overlapping circles, with more overlapping circles added for more complex subjects.
Where can I find free graphic organizer printables?
While you don’t need to use a pre-printed organizer every time, they can be especially helpful with younger students as they learn how this valuable tool works. The internet is full of graphic organizer printables, both free and for purchase on sites like Teachers Pay Teachers. Here are some free options we’ve created for teachers to try.
- Summary Graphic Organizer
- Summarizing Graphic Organizers (Grades 2-4)
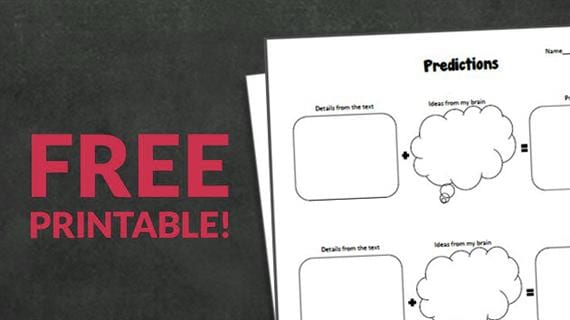
- Predictions and Inferences Organizer
- Scientific Method Graphic Organizer
- Continents Graphic Organizer
Get all the latest free printables and teaching ideas when you sign up for our newsletters.
Plus, Anchor Charts 101: Why and How to Use Them.