Sports Analytics Math Challenge Bundle
$12.99
Description
Turn students into sports data analysts as they collect, calculate, graph, and interpret real-world sports statistics to make predictions and defend evidence-based conclusions. 🏈⚽📊
This Sports Analytics Math Challenge Bundle is a project-based learning resource that combines math, data analysis, statistics, graphing, and critical thinking through the exciting lens of sports. Students choose a professional, college, or school team and investigate real game data or use provided datasets to calculate averages, percentages, ratios, ranges, medians, and trends. They then use their findings to predict future performance and present their conclusions like professional sports analysts.
The project guides students through the complete data-analysis process: collecting information, organizing data, calculating statistics, creating graphs, identifying trends, making predictions, and defending claims with evidence.
What’s Included in the Sports Analytics Math Resource
This resource supports students as they develop mathematics, statistics, graphing, and data-analysis skills through authentic sports investigations. The digital download includes:
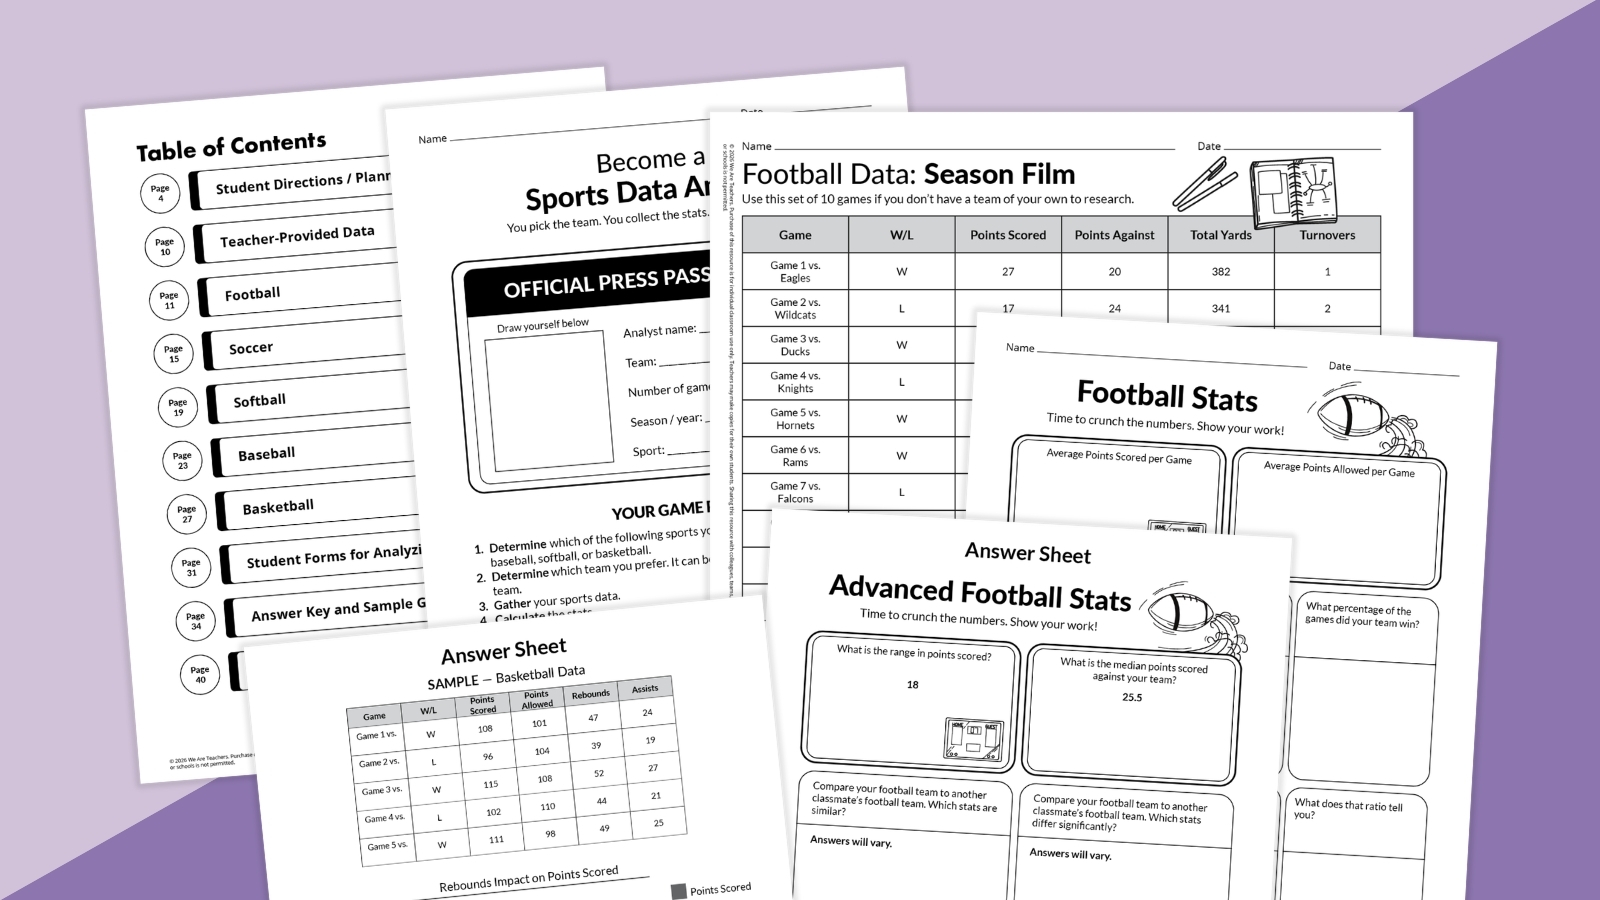
✔ Sports Data Analyst Project planner and student guide
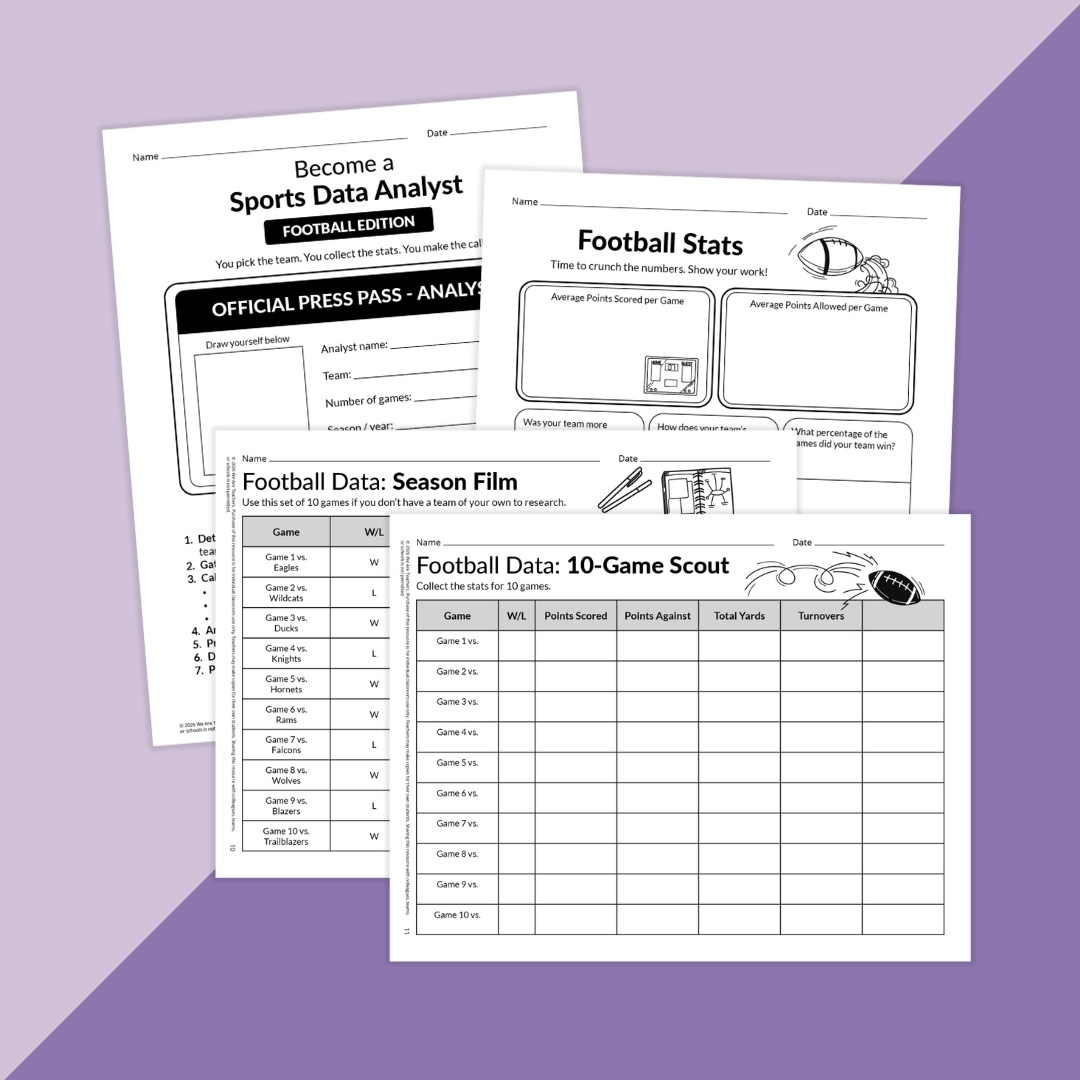
✔ Football analytics investigation
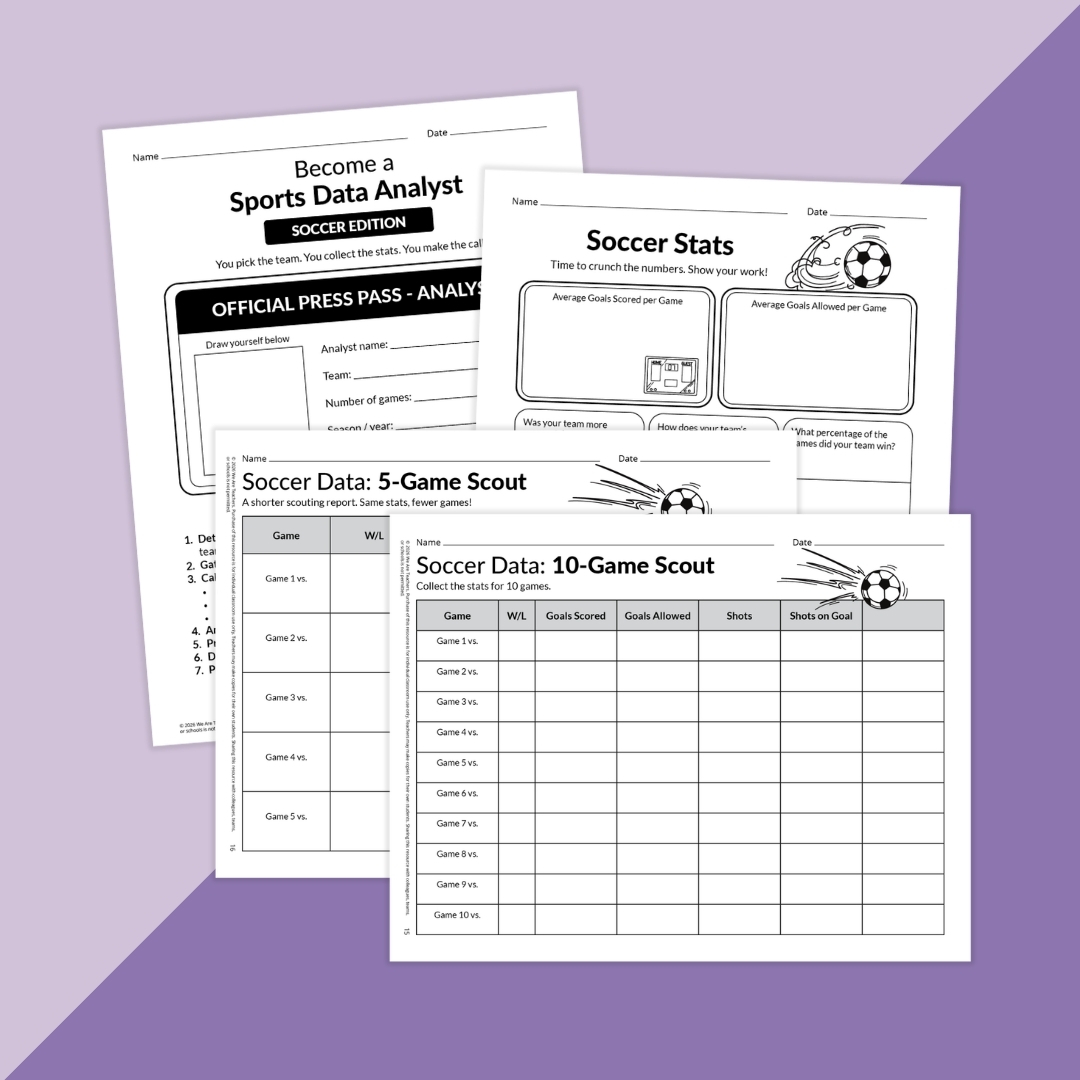
✔ Soccer analytics investigation
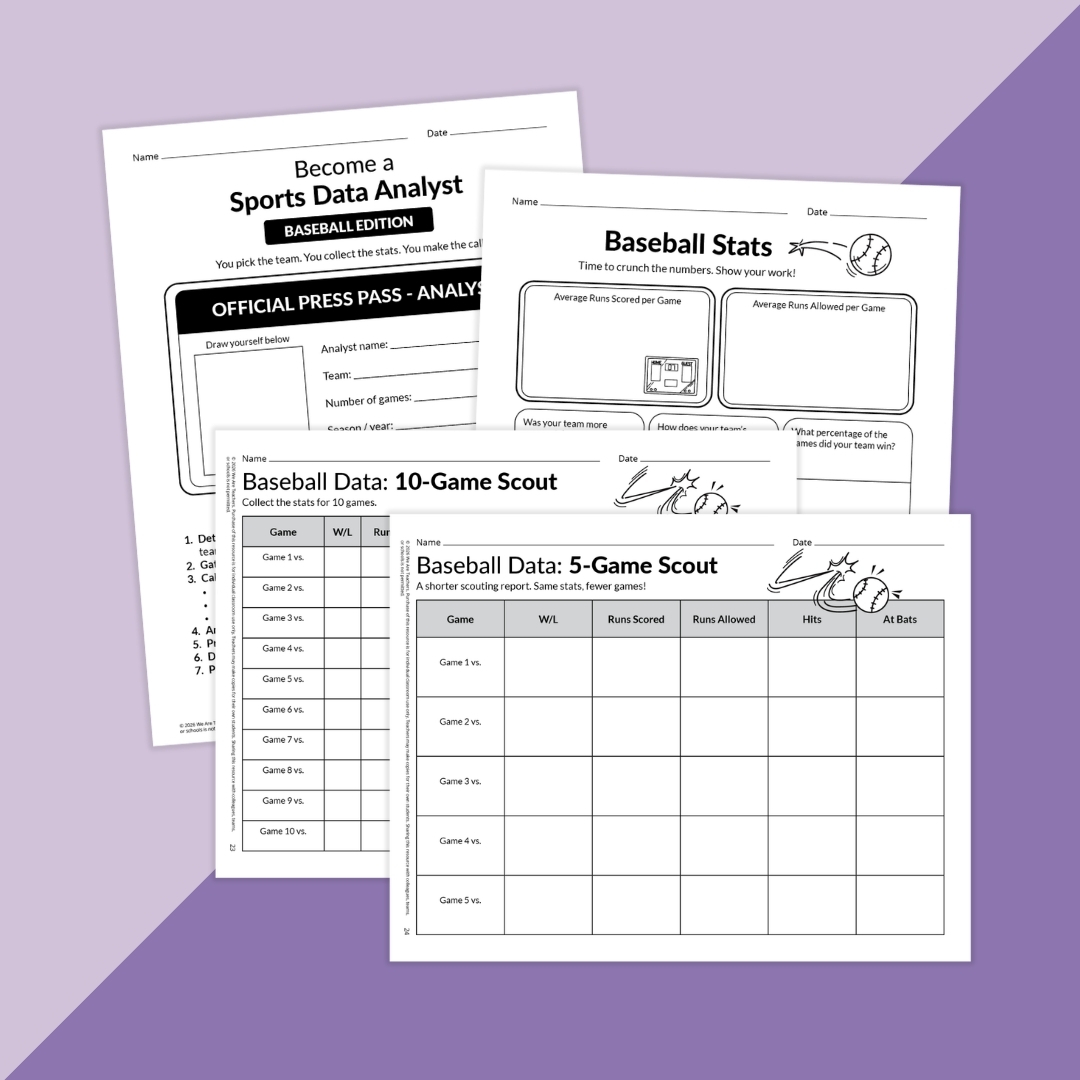
✔ Baseball analytics investigation
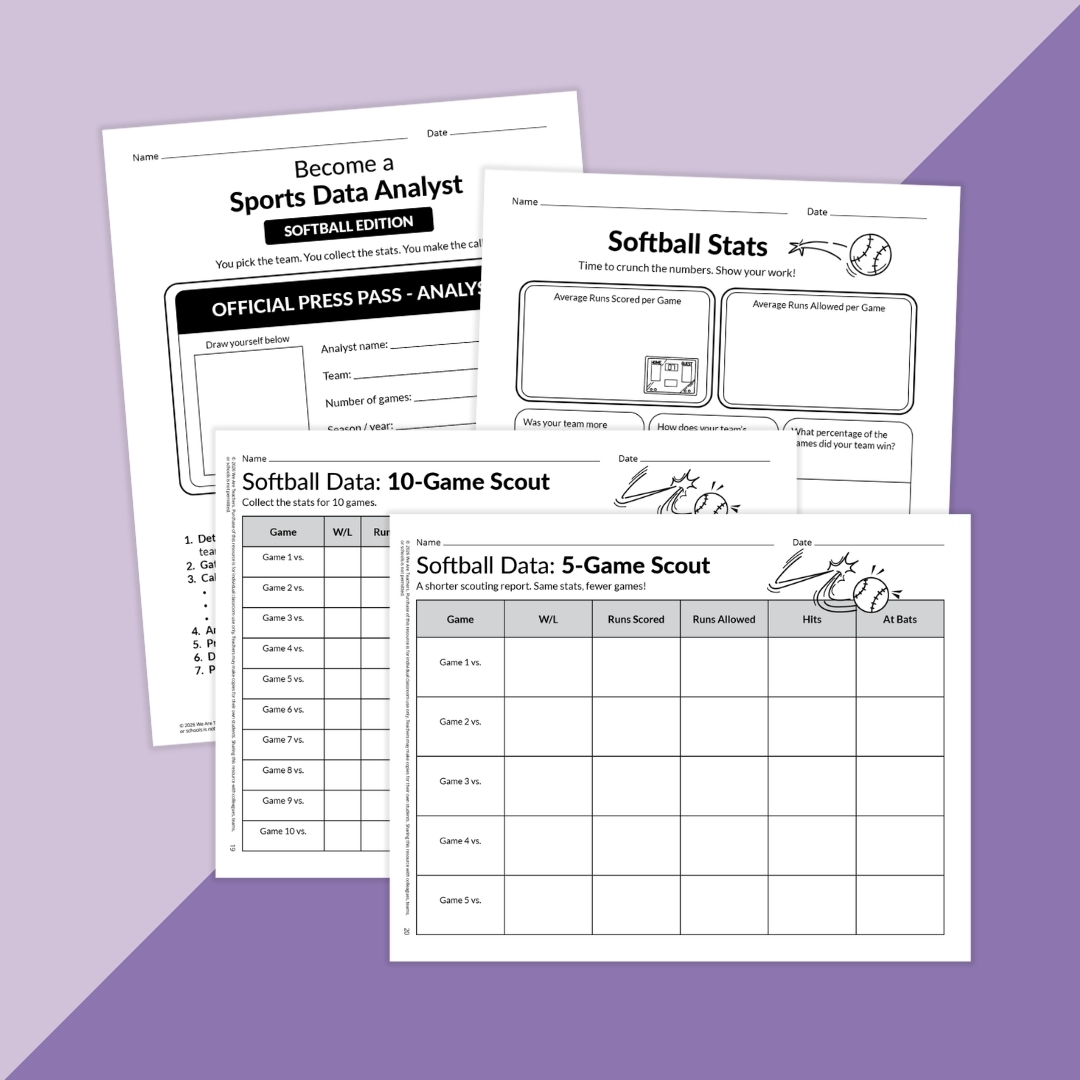
✔ Softball analytics investigation
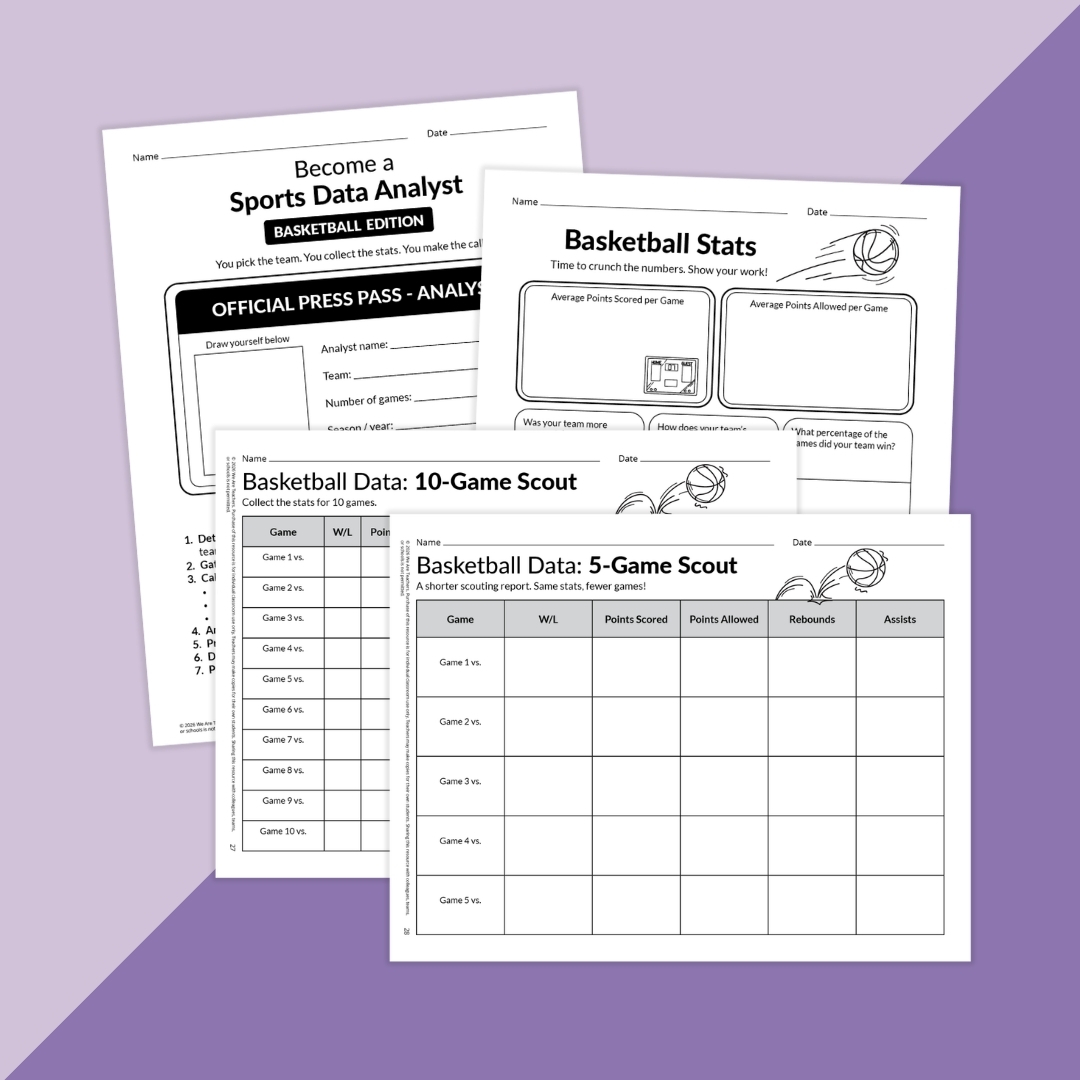
✔ Basketball analytics investigation
✔ Teacher-provided datasets for students who need ready-to-use information
✔ 5-game and 10-game data-collection options
✔ Sports statistics calculation worksheets
✔ Average, percentage, ratio, range, and median activities
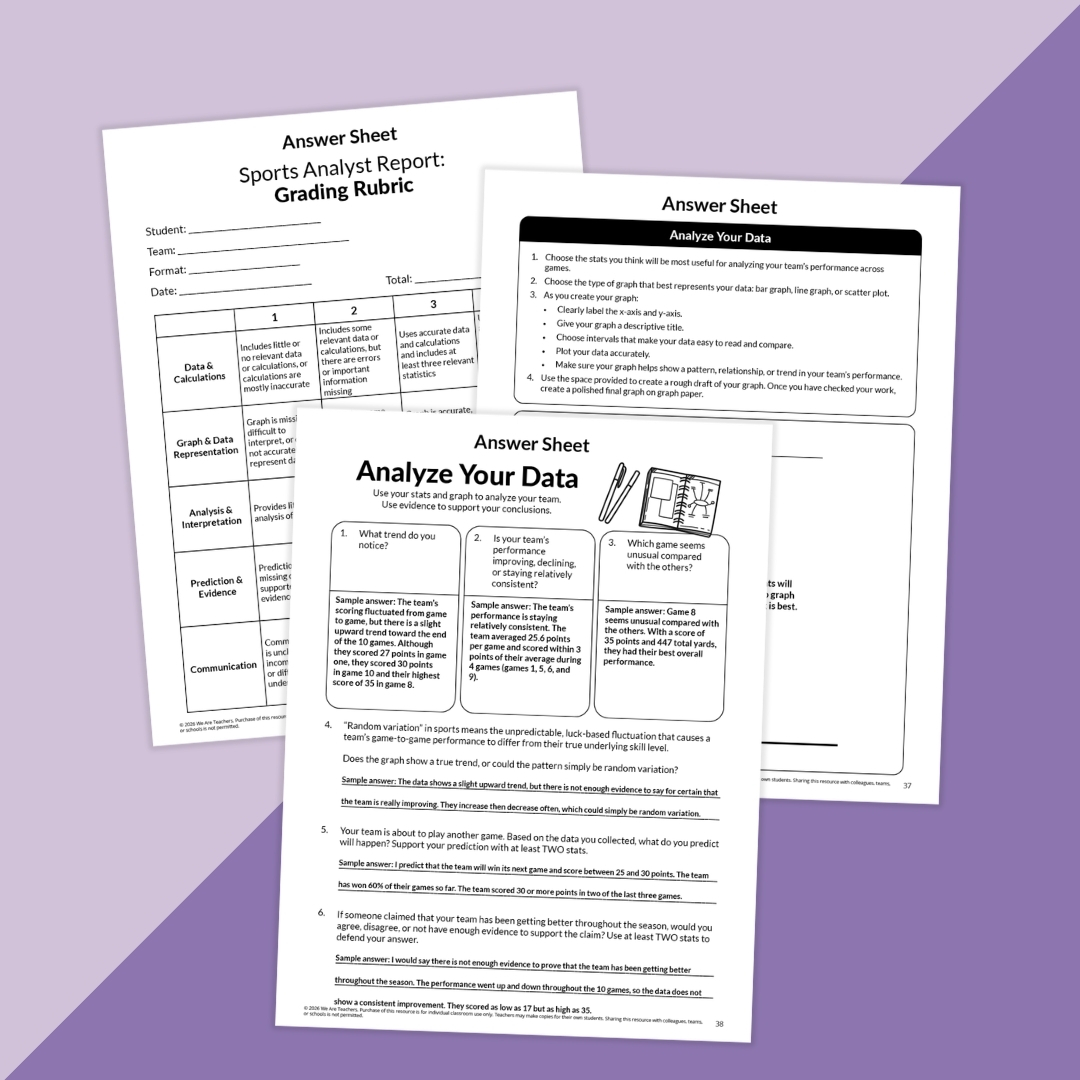
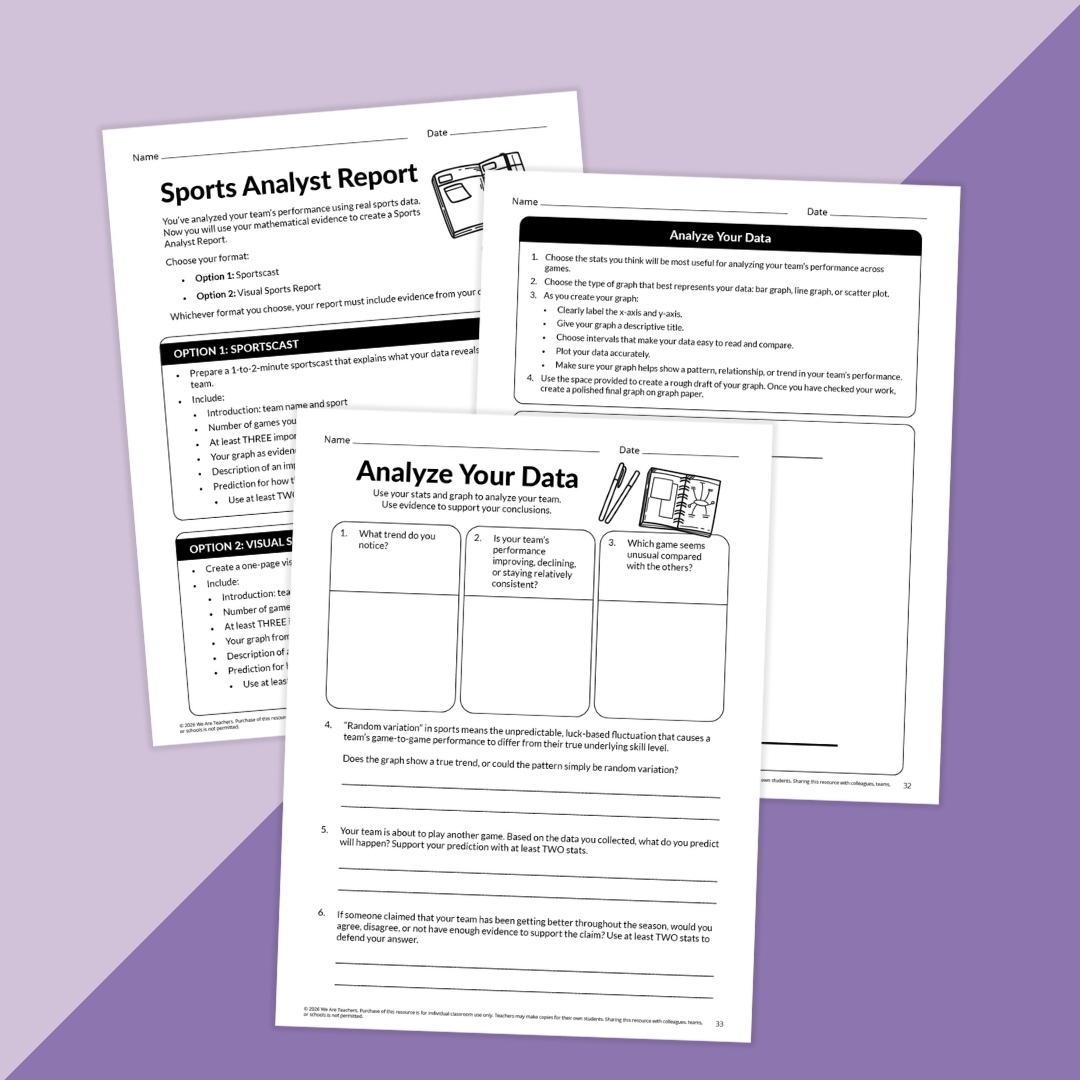
✔ Data-trend analysis worksheets
✔ Graphing and visualization activities
✔ Prediction and evidence-based reasoning tasks
✔ Sports Analyst Report project
✔ Sportscast presentation option
✔ Visual report presentation option
✔ Grading rubric and answer key
Classroom Ideas
This sports analytics resource works well in middle school math classrooms, enrichment programs, project-based learning units, statistics lessons, gifted programs, STEM activities, and cross-curricular projects. Here are some ideas for using this resource in the classroom:
Apply math to real-world data
Help students see how averages, percentages, ratios, and statistics are used by coaches, sports analysts, and data professionals.
Strengthen graphing skills
Guide students as they organize data, select appropriate graph types, identify patterns, and communicate results visually.
Develop statistical reasoning
Use authentic sports data to help students analyze trends, compare performance, identify outliers, and interpret results.
Make predictions using evidence
Encourage students to use mathematical data to forecast future outcomes and defend their predictions using statistics.
Explore multiple sports
Allow students to choose from football, soccer, baseball, softball, or basketball based on their interests.
Build communication skills
Challenge students to present findings through a sportscast or visual analyst report using evidence from their investigation.
Encourage higher-level thinking
Move beyond simple calculations by asking students to evaluate trends, consider random variation, and defend claims with data.
✨ The result?
Students develop stronger data-analysis, graphing, statistics, and mathematical reasoning skills while engaging in a high-interest project that shows how math is used in the real world every day.