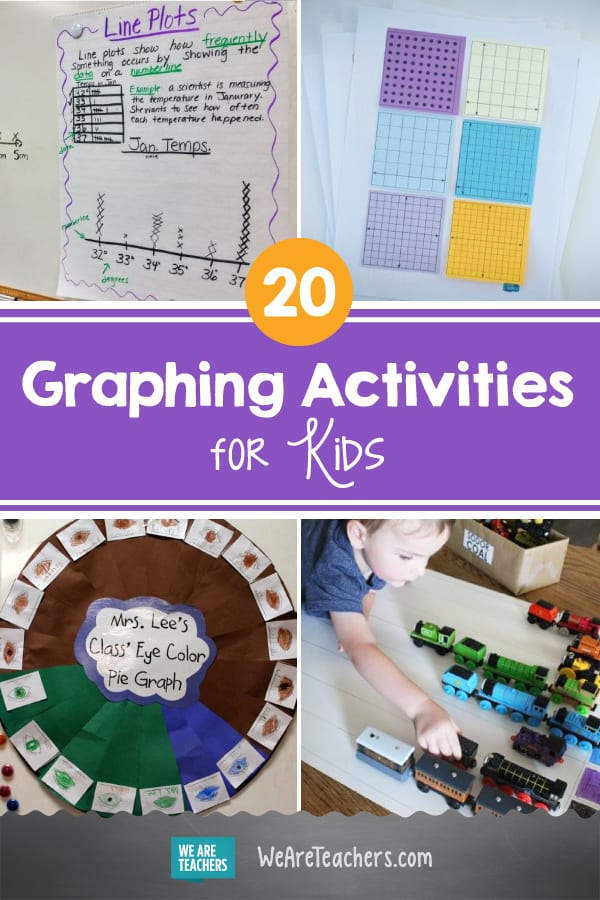
Math students often ask “But when will I use this in real life?” Gathering data and creating maps both have a lot of real-world applications, so these are key skills for kids to understand. Help them master bar graphs, line graphs, scatter plots, pie charts, and more with these fun and creative graphing activities!
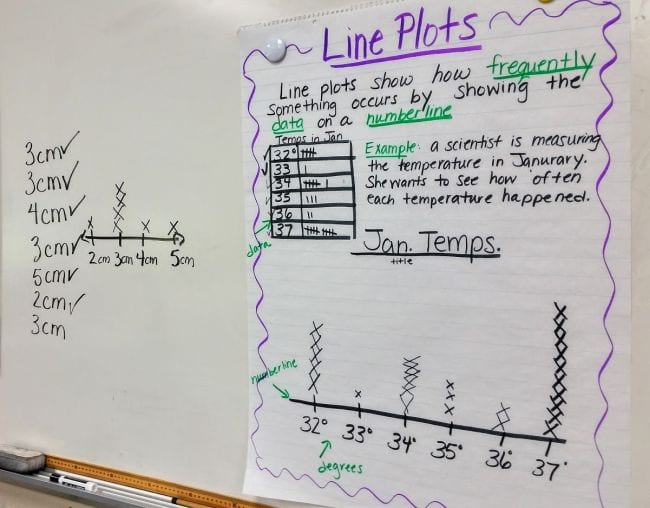
1. Make an anchor chart or two.
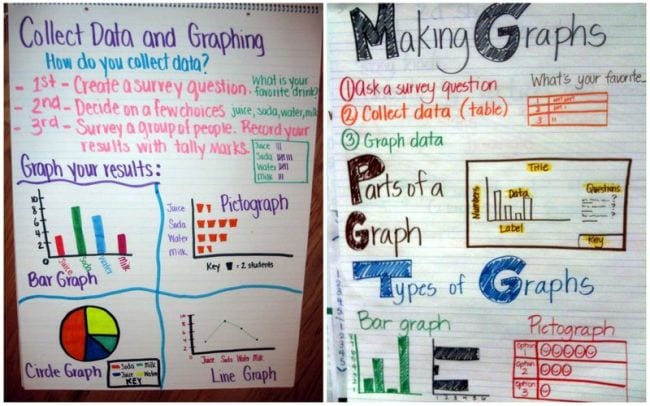
Anchor charts can help math students remember the parts of a graph and how to use the different types for showcasing data.
Learn more: Top Notch Teaching
2. Introduce graphing with a pocket chart.
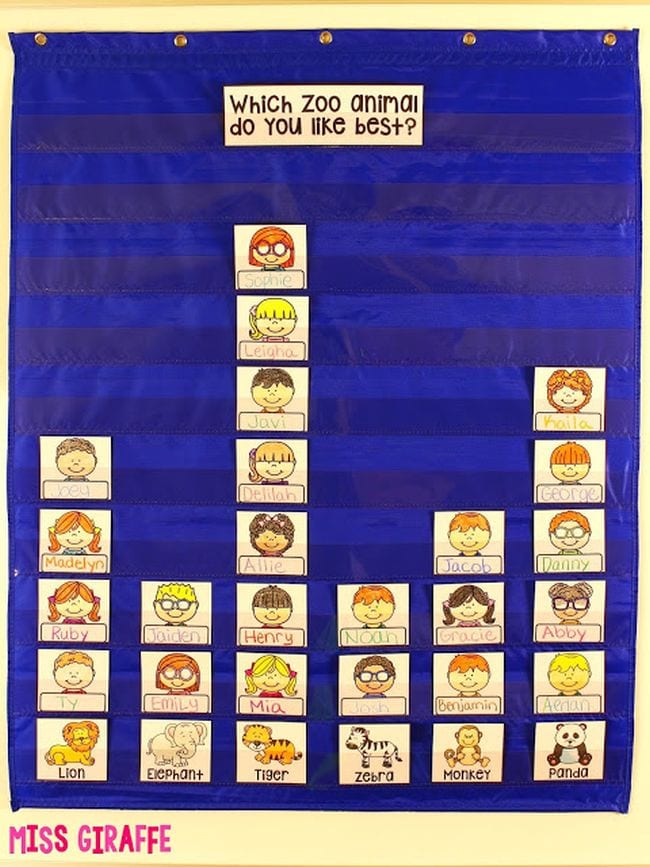
Pocket charts are so handy! Use them for graphing activities by taking class surveys and slipping student answers into each column or row.
Learn more: Miss Giraffe’s Class
3. Snack and graph with treats.
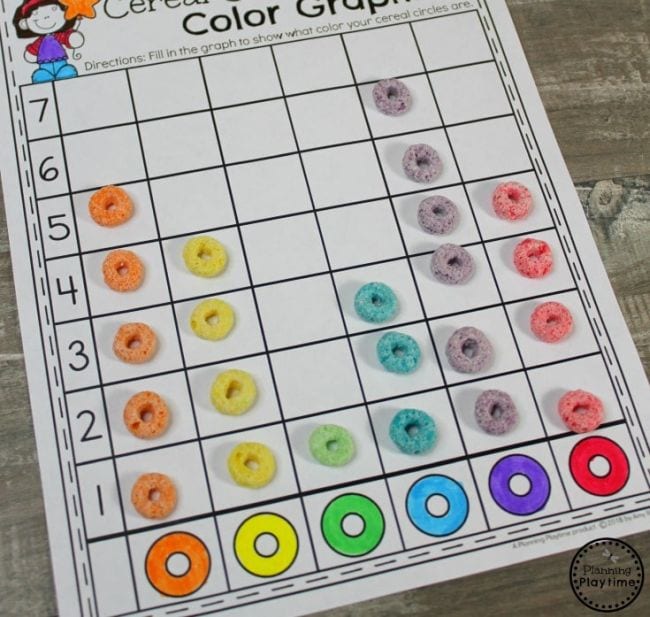
Give each student a handful of Froot Loops and have them create a graph of the colors. They can snack on them when they’re done!
Learn more: Planning Playtime
[contextly_auto_sidebar]
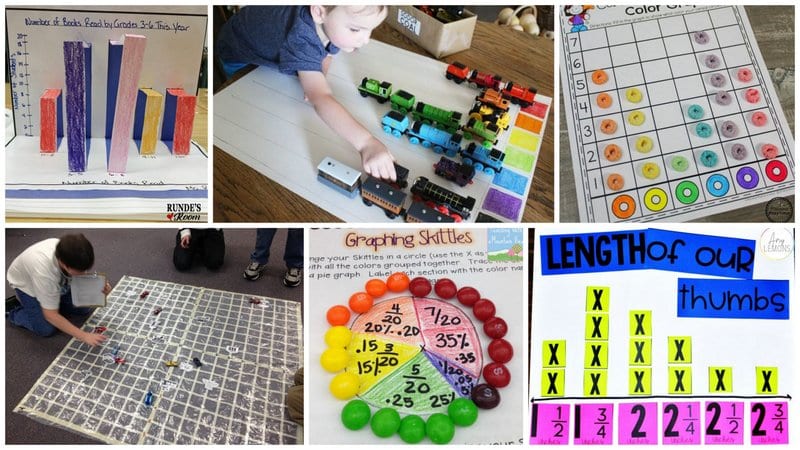
4. Use toys to make a pictograph.
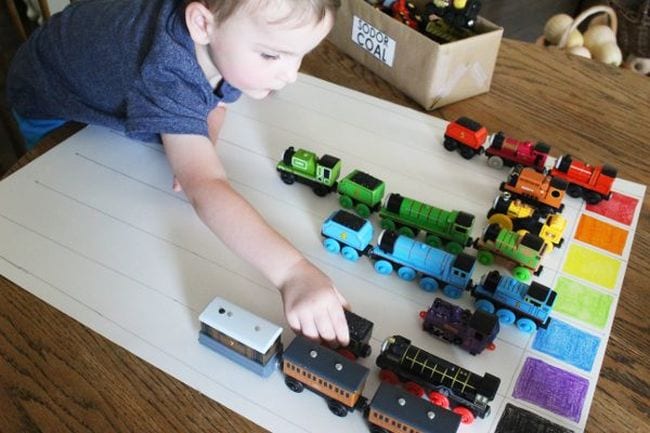
Raid the toy box and use toy cars, trains, or whatever you have on hand to create simple real-life pictographs. Sort by color, length, type, number of wheels … the possibilities are endless.
Learn more: Mom Life Made Easy
5. Graph the water bottle challenge.
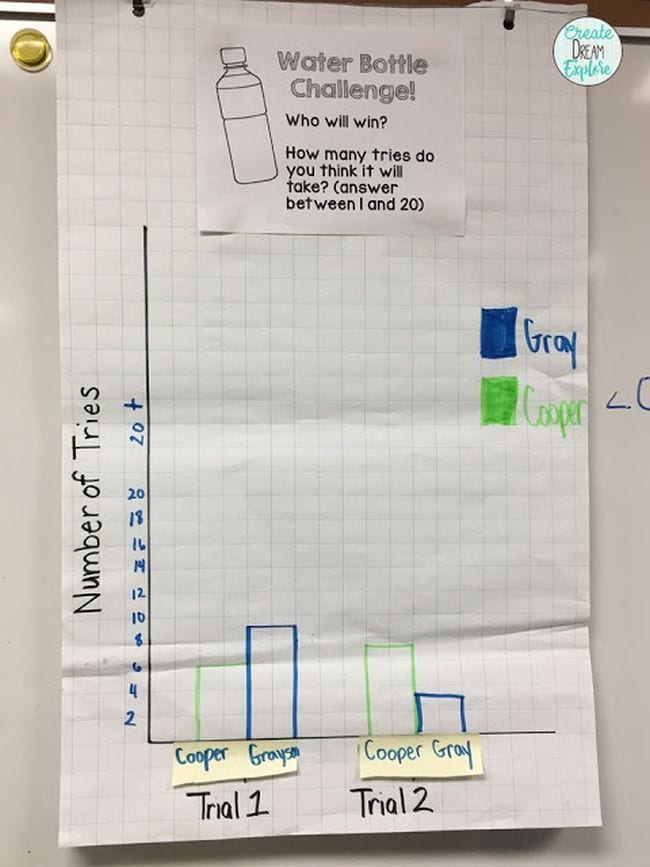
If your students still get a kick out of trying to master the water bottle challenge, turn that fascination into a lesson on graphing. Fun + learning = awesome.
Learn more: Create Dream Explore
6. Measure and graph your thumbs.
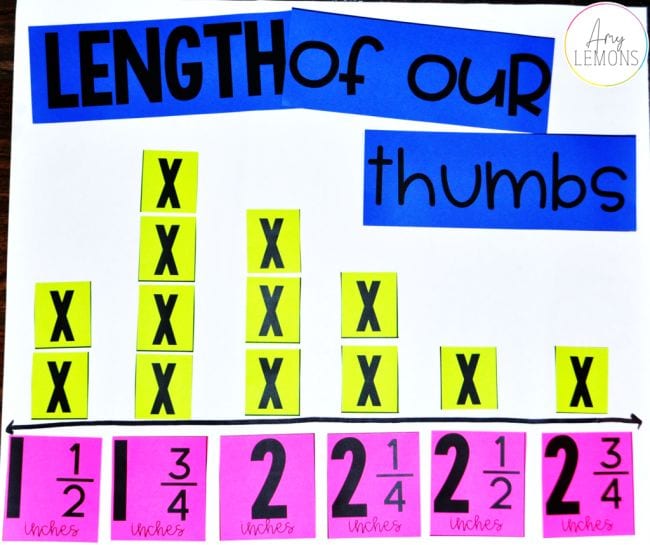
Graphing activities like this one combine two math activities in one. Kids work on their measuring skills, then graph their results.
Learn more: Amy Lemons
7. Take a nature walk.
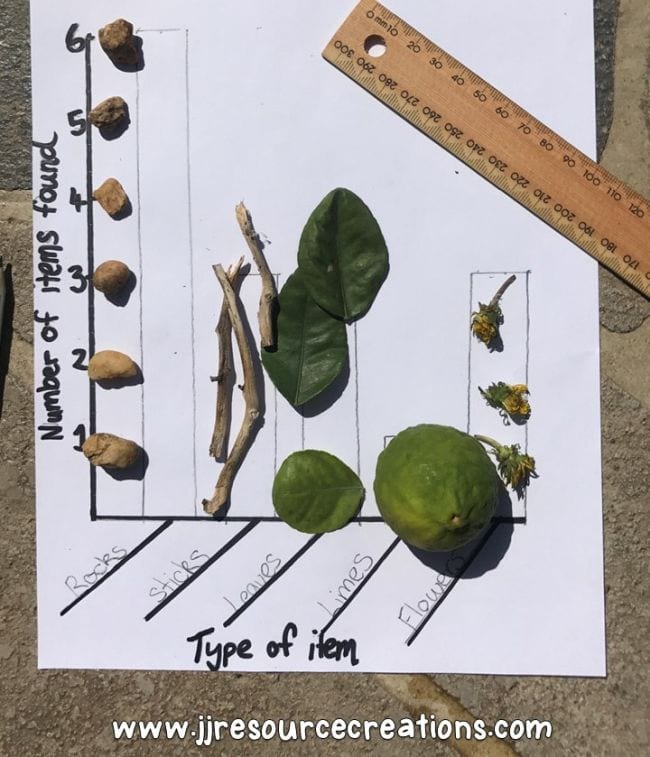
Head outside and take a stroll, gathering sticks, rocks, flowers, and leaves. When you return, create a graph to represent your finds.
Learn more: Mrs. J’s Learning Made Fun
8. Bowl and graph.
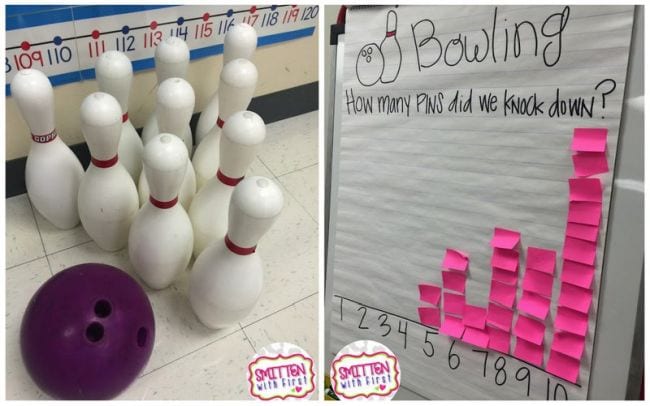
Who doesn’t love math activities that get kids up out of their seats, burning off some excess energy? They’ll enjoy getting to bowl in class—pick up an inexpensive bowling set at the dollar store, or learn to make your own at the link.
Learn more: Smitten With First
9. Flip a coin.
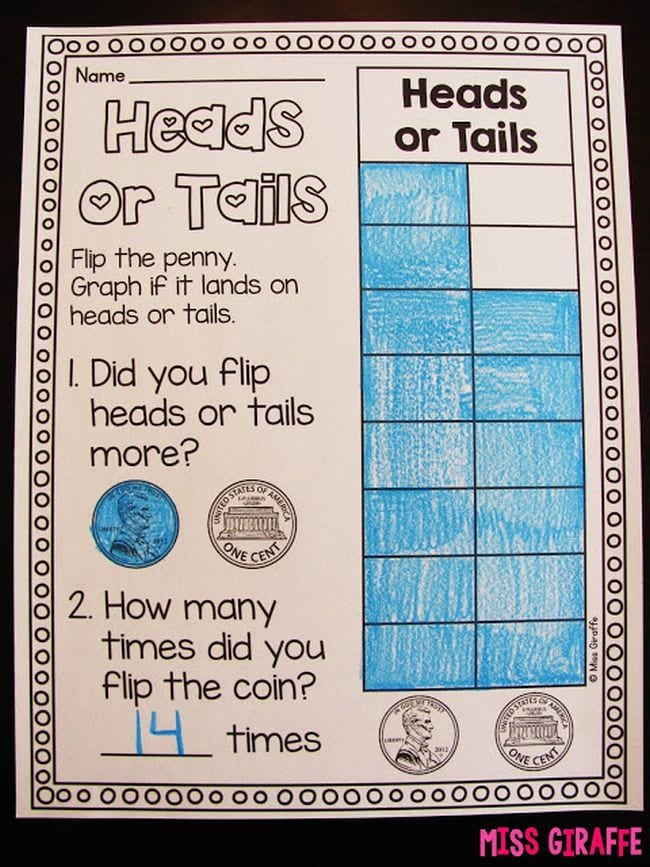
Flipping a coin is an easy way to generate data for a bar graph. The only trouble might be getting kids to stop!
Learn more: Miss Giraffe’s Class
10. Construct a pop-up bar graph.
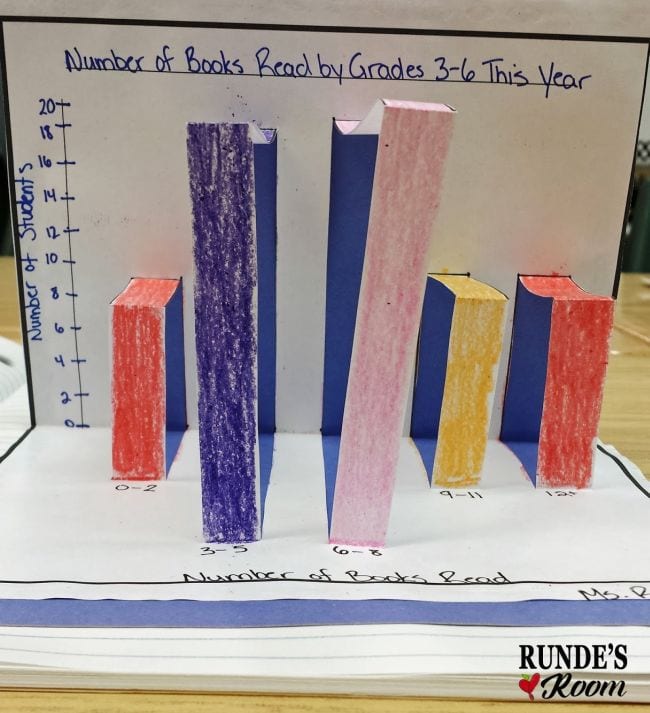
How cool is this graphing activity? A pop-up bar graph brings the data right off the page. Hit the link to learn how it’s done.
Learn more: Runde’s Room
11. Graph the number of letters in your name.
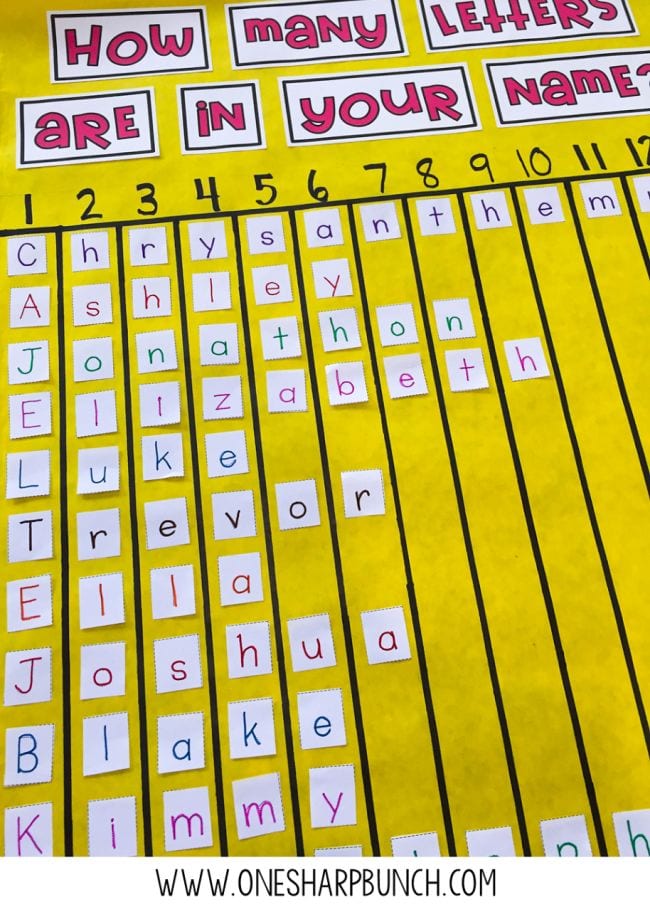
Here’s a clever way to show bar graphs that run horizontally instead of vertically. Find this and more activities to use with the book Chrysanthemum at the link.
Learning more: One Sharp Bunch
12. Aim at a target.
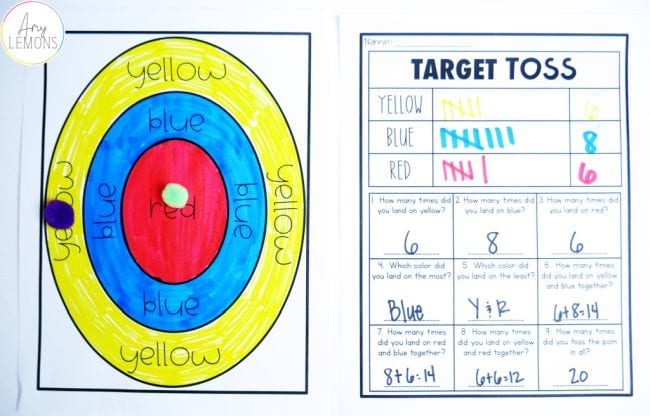
Snag a Velcro dart board at the dollar store or make a target from paper and pom-poms. Kids will have a blast aiming for the target to gather data before they graph their findings.
Learn more: Amy Lemons
13. Read books and make a tally chart.
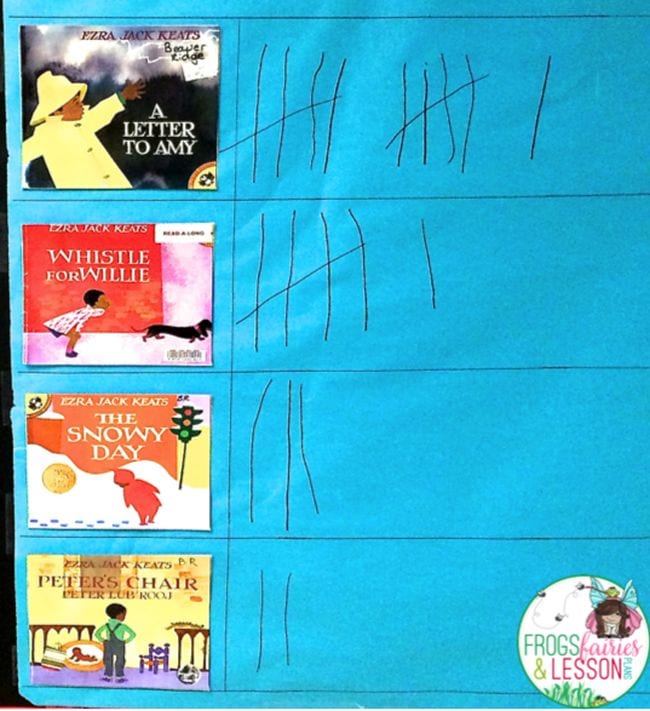
Take a survey of your class to find their favorite of the books you’ve read lately. Then make a tally chart graph to see which one is the most popular.
Learn more: Frogs, Fairies, and Lesson Plans
14. Watch the weather.
Some graphing activities make it easy to see the real-world connection, and this is one of them. Students monitor daily temperatures and use them to create graphs and make predictions.
Learn more: The Applicious Teacher
15. Play a game of tic-tac-graph.
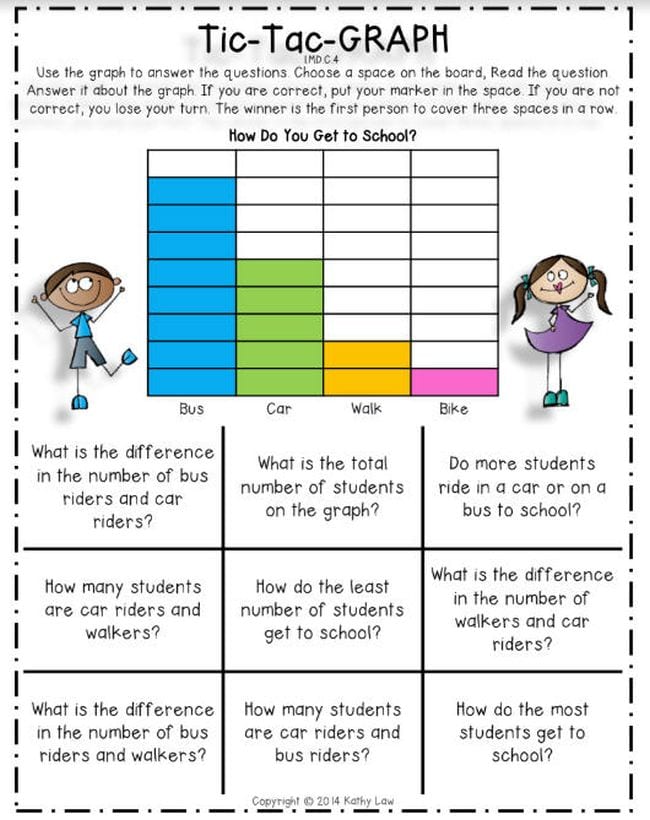
Creating good graphs is important, but so is knowing how to read them and interpret the data. This free printable asks kids to answer questions based on the information shown in a simple bar graph.
Learn more: First Grade a la Carte
16. Count Skittles to make a circle graph.
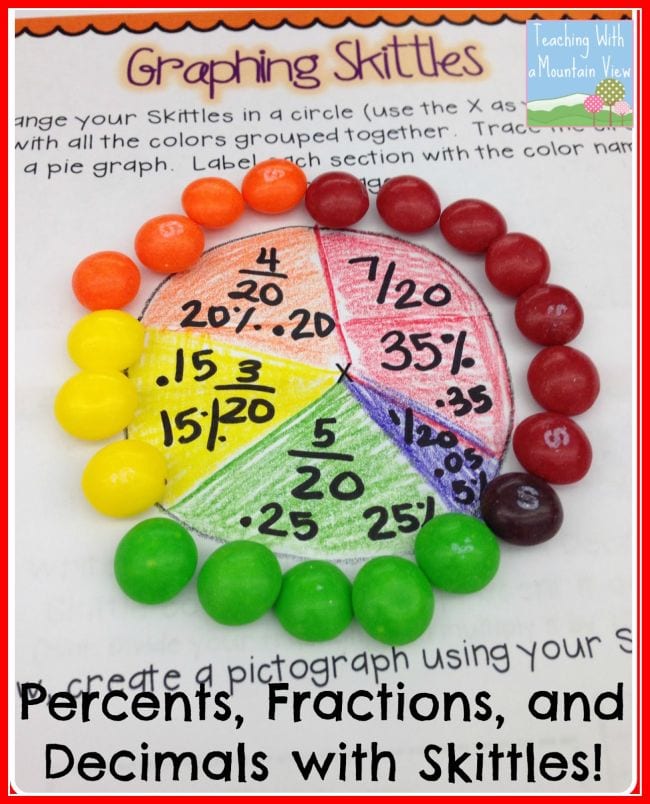
This activity has so many math skills rolled into one! Kids create a circle graph using candy, then figure out the correct fractions and percentages represented by the data.
Learn more: Teaching With a Mountain View
17. Make a pie chart from eye colors.
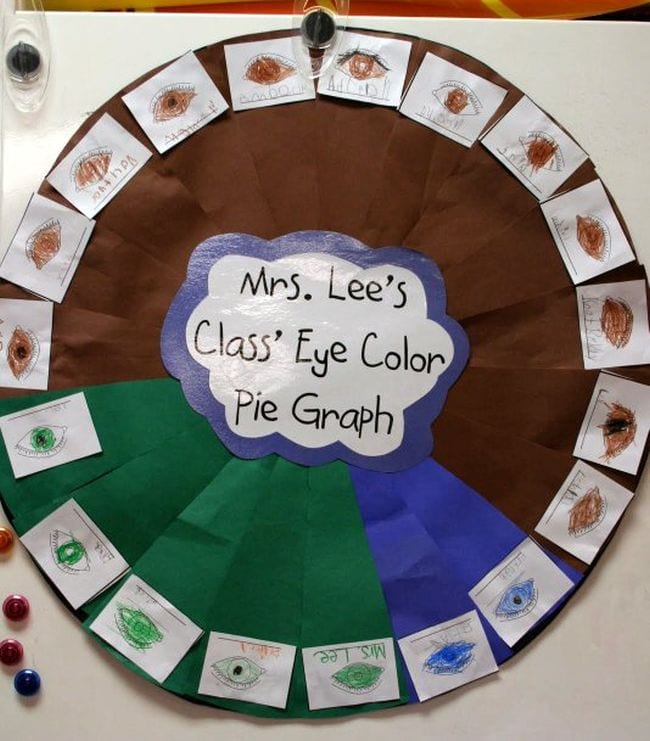
Eye color is another fun way to make a circle graph, also called a pie chart. Combine it with a lesson on eye anatomy for a double whammy!
Learn more: Mrs. Lee’s Kindergarten
18. Print graphs on sticky notes.
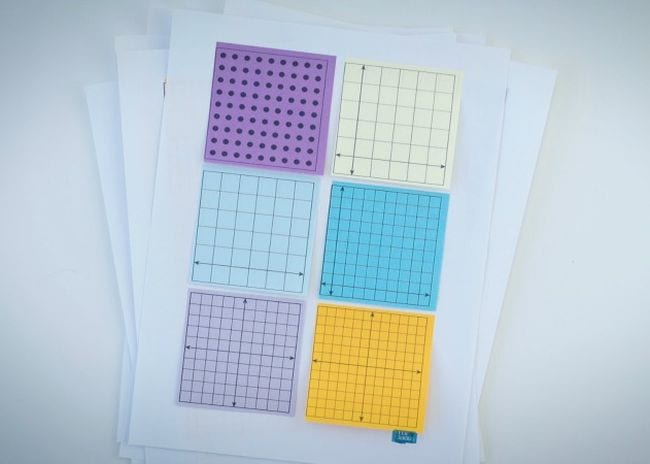
Did you know you can print on sticky notes with a simple template? It’s life-changing! Use this hack to make notes to use for all kinds of graphing activities. Get the how-to here.
19. Build a scatter plot graph with M&Ms.

Older elementary students start to explore scatter plot graphs, which examine how pieces of data correspond to each other. Give them a basic introduction to how they work with this M&Ms activity.
Learn more: Math = Love
20. Create a coordinate plane city map.
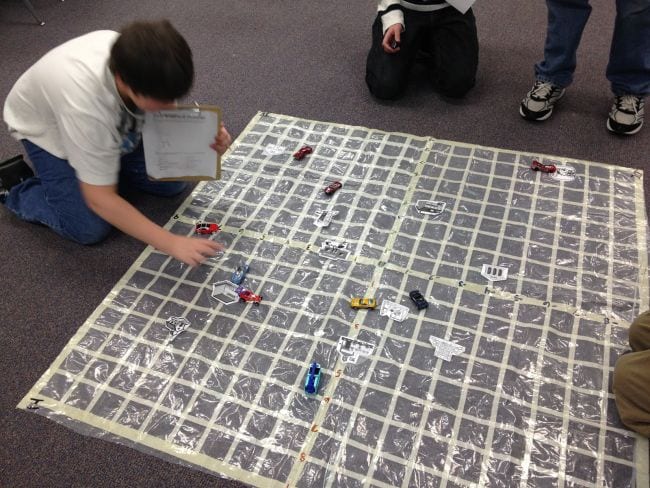
Coordinate planes are the most complicated form of graph, but learning to plot points on them is easier than it seems. We love this incredibly fun activity that turns a coordinate plane into a town map … and kids will love it too.
Learn more: For Such a Time As This
We’ve got so many great resources for teaching K-5 math! Check them all out here.
Plus, get 65+ STEAM Apps for Kids and Teens.